Productivity Report
This report shows meter reading statistics and metrics by route and by meter reader. You can use this report to see the meter reading productivity on specific routes and for specific meter readers, and adjust resources to maximize meter reading efficiency.
Report fields that are compared against a route average include an icon that indicates whether the value is higher ( ) or lower (
 ) than the route average.
Following is a list of report conditions:
-
When you select All for the route status, the report includes both active and closed routes.
-
When a route has been read by multiple meter readers, including hybrid routes picking up AMI reads and being read AMR, the route is split into multiple rows on the report, one for each reader. AMI reads also have their own rows. For example, if both John Smith and Bob Smith read a route, with some reads received from the AMI network, the report includes a row for John, a row for Bob, and a row for AMI.
-
When a route is read over multiple calendar days, even by the same meter reader, each calendar day is displays on separate rows. This is done to avoid time spent not meter reading from skewing the route metrics.
-
Only these report columns display in a row with an AMI meter reading: Import Date, Cycle / Route, Num Meters, and Num RD. All other columns are blank or display a dash ( - ).

What You Can See and Do in This Window
Click a link to display the related information or step-by-step procedure.
| – | |
| – | |
Run the Report
NOTE: Not all reports follow every step in this section. Complete only the steps that apply to the report you run.
Follow the steps to run the report. After running the report, some reports have Route and Group filters you can apply to narrow down the data in the report grid:
- Route – filter the report by the selected routes. If you do not select a route, then the report displays all routes by default.
- Group – if Filtering by Groups is available, by default, no groups are selected and all endpoints are included. You can include only endpoints for the selected groups in your report, or exclude endpoints within the selected groups.
- On the Neptune® 360™ left navigation panel, click the report name.
- If required, select the To and From dates to display the report within a specific date range, and then click Apply.
Some reports have only one date for selection.
- To filter the report by a specific route, in the Route field, select the route. If you do not select a route, all routes are included in the report.
- To run the report by a specific group, in the Group field, select the group.
- To include or exclude endpoints within a group, do one of the following:
- Include only the endpoints in the selected groups – click Include, and then select the groups.
- Exclude all endpoints within the selected groups – click Exclude, and then select the groups. The report displays all endpoints, except the selected groups.
- To include endpoints with a particular status or all endpoints, in the Endpoint Status field, select one of the following:
- Active
- Inactive
- All
- Select other options specific to the report, as required. See the Report Field Descriptions table below for a description of additional report fields and examples of what to select and enter into the fields.
- If required, click Submit to run the report.
Each report shows related data in grid or table format.
- See the following table for the description of each field within a report.
Customize a Report Grid
After you run a report, apply the following options to customize the report grid.
| To... | Complete These Steps |
|---|---|
| Export the report details to a PDF or Excel file, |
Click |
| Sort data in a column in either ascending or descending order, | Next to the column header, click  and then select the desired sort order. and then select the desired sort order. |
| Customize the columns that appear in the report, |
|
| Change the placement of a column in the grid, | Click and drag the column heading to the new location on the grid. |
| Access the Customer Inquiry page for more details on the column data, | If available for the report, click  in the column for which you want more detail to display the detail on the Customer Inquiry page. Mouse over the last column in the report to display the icon to click. in the column for which you want more detail to display the detail on the Customer Inquiry page. Mouse over the last column in the report to display the icon to click. |
 to display the export options, and then select the desired option. You can print and save the PDF or Excel file.

Reports Field Descriptions
The following table defines all fields that appear on the reports, in alphabetical order.
| Field | Description |
|---|---|
| # Occurrences | Number of occurrences of the invalid reading type within the time frame selected. |
| Account Number (#) | Account number associated with the endpoint. |
| Account Name | Customer name on the account. |
| Account Status | The status of the account. |
| Accuracy (decimal / percentage) |
Percentage of how accurate the value returned from the Geocodio database is.
|
| Accuracy Type |
The location on or around the premises against which the geocoding is measured for accuracy. For example:
|
| Actual vs. Estimated | Toggle that allows you to select either actual data or estimated data to display in the report. |
| Address / Premises Address / Current Service Address | Short version of the customer address associated with the account. Includes address lines 1 and 2. |
| AMR / AMI | Indicates whether the endpoint is read by AMR or AMI. |
| Avg Consumption | Average daily consumption. |
| Avg Daily Flow (Event) | Average number of gallons (or alternate unit of measure) consumed during the recorded days of potential leaks. |
| Avg Daily Flow (Prior) | Average number of gallons (or alternate unit of measure) consumed prior to the recorded days of potential leaks. Compare this number to the Avg Daily Flow (Event) consumption. |
| Avg Elapsed Time (mm:ss) | Average time elapsed for each reading captured. |
| Avg Route Avg | The route average since the inception of the route when readings began. |
| Avg vs Route Avg (mm:ss) |
Difference between the average and the route average readings. Route average is calculated based on AMR readings and AMI readings are excluded. |
| Backfill | Endpoint displays N/A or Yes if the date and time of the last read compared to the current time is greater than 24 hours, then the endpoint is in backfill. Backfill indicates that an endpoint has gone too long without transmitting and is now sending stored historical readings to catch up, usually due to temporary communication loss, weak signal, improper activation, or delayed transmission caused by power or firmware issues. |
| Begin Date | Seven days prior to current date. |
| Changed Parameter | Field changed from the mobile app. |
| City | City of the meter location. |
| Codes | Comment codes associated with the endpoint / meter. Codes are displayed as [Code]-[Description]. |
| Comments | Free-form notes that apply to the report data. |
| Comment Codes + Description | Comment codes associated with the endpoint, plus a description of each code. Codes are displayed as [Type] [Code]-[Description]. [Type] is abbreviated as CC. |
| Consec Days |
|
| Consumption | Total volume of consumption (by hour or by day), since the last reading for the meter / endpoint. Applies to both active and inactive endpoints. The reading includes three decimal points. |
| Consumption Flag | Current Consumption Flag (Reverse Flow Status) Code. |
| Conv | UOM |
| Created Date | Date and time the premises was geocoded. |
| Current Account Name | Current customer name on the account. |
| Current Account Number | Account number associated with the meter. |
| Current Endpoint ID | Identification number for the endpoint. Note that this is not the same number as the meter ID. |
| Current Reading / Last Reading | Most recent meter reading. Depending on the report, this may be the last invalid reading. |
| Current Service Address | Short version of the customer address associated with the account. Includes address lines 1 and 2. |
| Current Turn Count | The number of times a MACH 10 valve has completed a command. |
| Cycle / Route |
|
| Date | Date when customer notes are recorded, or date the specific geocode was last updated, in MM/DD/YYYY format. |
| Date / Time |
|
| Days | Total number of consecutive days the system recorded a potential reverse flow on one or more meters. |
| Days to Avg | Number that represents the number of days over which to average the consumption. The start date is today and go back "X" number of days. The maximum days allowed is 30 and the minimum is 1. |
| Days of Low Power | Number of days at low power. |
| Days Range | Range of days associated with the days of consumption. |
| Days Since Last Read | Number of days since the system received the last valid reading. |
| Description | Description of the issue that caused the most recent invalid reading. |
| Dials | Number of dials specified on the import file for the meter. |
| End Date | Current date. |
| Endpoint Battery Life | Voltage percentage remaining on the battery. |
| Endpoint Configuration | Style of endpoint, such as wall, pit, internal antenna, external antenna. |
| Endpoint ID | Identification number for the endpoint. |
| Endpoint Type | Type of endpoint such as cellular (CMIU), LoRaWAN, or R900. Cellular endpoints may also show the cellular carrier such as ATT, FirstNet, or Verizon. |
| Endpoint Status | Status of the endpoint, either active or inactive. |
| Estimated vs. Actual | Toggle that allows you to select either actual data or estimated data to display in the report. |
| Event Start Read Date | Date stamp of the first day of the event where all received intervals had consumption. |
| Event Stop Read Date | Date stamp of the last day of the event where all received intervals had consumption. Displays Active if the event has not ended (last day of data shows consumption in every received interval). |
| Firmware Version / Endpoint Firmware Version | Version of the firmware currently installed on the endpoint. |
| First Heard | Date and time stamp of the first reading for the found endpoint, in MM/DD/YYYY HH:MM:SS (24-hour time) format. |
| Flag Start Read Date |
Date and time the reading began, in MM/DD/YYYY format. Note: For the Reverse Flow Report, this is for AMI only. |
| Flag Stop Read Date |
Date and time the reading ended, in MM/DD/YYYY format. Note: For the Reverse Flow Report, this is for AMR only. |
| Flag Status | The latest consumption flag status (Normal, Intermittent, Continuous). |
| Flag Type |
Type of Reverse Flow flag reported:
|
| Flow Type | Intermittent or continuous. |
| Group Filter | List of all groups you can include or exclude in a report for the utility. |
| High Limit | Highest reading expected for the endpoint, as determined by the billing system. |
| Import Date | Date the reading was imported into Neptune 360, in MM:DD:YYYY format. |
| Initial Event DateTime | Date and time of the first low power event. |
| Install Date |
The date the endpoint was installed. |
| Inactive Since | The date and time stamp when the meter / endpoint was set as inactive. |
| Initial Event DateTime | Date and time of the first low power event. |
| Initial Installation Date | The date the meter was first installed. |
| Invalid Read |
An invalid reading recorded for the endpoint: UUUUUUUU -> Reading Error:::::::: -> Failure to Retrieve Reading ???????? -> Non-Numeric Reading MMMMMMMM -> Reading History Not Available |
| Invalid Reading Date | Date and time stamp for the invalid reading recorded, in MM/DD/YYYY HH:MM:SS format. |
| Invalid Type | The characters associated with an invalid reading. See the Troubleshooting Reference for details about each invalid reading type and recommended field actions. |
| Keyed Reading | Meter reading that is manually keyed into the system. |
| Last Read | Last valid reading for the endpoint regardless of the entered start and end dates. |
| Last Read Date | Date and time stamp for the last valid reading recorded, in MM/DD/YYYY HH:MM:SS format. |
| Last Reading / Current Reading | Most recent meter reading. Depending on the report, this may be the last invalid reading. |
|
Last Reading Date and Time / Timestamp |
Date and time of the last meter reading in MM/DD/YYYY HH:MM:SS format. Depending on the report, this may be the last invalid reading. |
| Last Transmission Date | The date and time the endpoint last transmitted date, in MM/DD/YYYY HH:MM:SS format. |
| Last Valid Reading | Date and time of the last valid reading for the meter in MM/DD/YYYY HH:MM:SS format. |
| Latest Reading is Valid | Indicates whether the latest reading for the endpoint is valid (Y for yes, N for No). |
| Latest Occurrences | Date and time of the latest invalid reading, in MM/DD/YYYY HH:MM:SS format. |
| Latitude | Latitude of the meter location. |
| Longitude | Longitude of the meter location. |
| Low Limit |
Lowest reading expected for the endpoint / meter, as determined by the billing system. Note: High Limit, Reading, and Low Limit are values at the time the failure occurred. The High and Low Limits must be saved since an import updates those values. |
| Max Elapsed Time (mm:ss) | Maximum time elapsed between readings captured. |
| Max Route Avg | Maximum route average. |
| Max vs Route Avg (mm:ss) | Difference between the maximum and the route average readings. Route average is calculated based on AMR readings and AMI readings are excluded. |
| Meter or Meter Number | Meter ID to which the report data applies. Note that this is not the same number as the endpoint ID. |
| Meter Install Date | Date the meter was installed on the premises, if provided in the import file. |
| Meter Reader |
|
| Meter Size | Diameter of the meter (in inches). |
| Meter Type | Type of meter installed on the customer premises. |
| Min Elapsed Time (mm:ss) | Minimum elapsed time between readings captured. |
| Min Hourly | The highest negative or lowest positive hourly consumption interval within the selected date range, formatted to three decimal places. |
| Min Route Avg (mm:ss) | Minimum route average reading. |
| Min vs. Route Avg (mm:ss) | Difference between the minimum and the route average readings since the inception of the route when readings began. Route average is calculated based on AMR readings and AMI readings are excluded. |
| Min Threshold |
Number that represents the least amount of daily consumption for that account that is considered high consumption. For example, if the minimum threshold is 100 and the daily usage is below 100 gallons, the account is not shown on the report. |
| MIU or MIU ID | Endpoint ID to which the report data applies. |
| MIU Status | Status of the meter / endpoint. See the Complete, Incomplete, and Skipped KPI for a definition of the status abbreviations. |
| Mobile Message Mode |
Endpoint displays Yes under these conditions:
The report may display a reading-related message when you hover over the warning symbol ( |
| Name | Customer name on the account. |
| Never Received | Endpoints that have been claimed by a site but not heard. |
| Num Comments | Number of meters that had a comment code or freeform note added. |
| Num Meters | Number of meters assigned to the meter reader for the specified day. |
| Num RD | Number of meters captured by the meter reader for the specified day. |
| Num SK | Number of skipped readings by the meter reader for the specified day. |
| Num UR | Number of unread meters for the meter reader for the specified day. |
| Number | Account number associated with the endpoint. |
| Over Amount | Amount that represents the number of times usage is over the average daily usage and is considered high consumption. For example: 2X, 3X, 4X. The default value is 2X. |
| Past Due | Endpoints that have been heard previously but not heard in X days (default is 3 days, but you can configure the number of days). |
| Premises | Physical location of the meter or endpoint. |
| Premises Key | Identification key for the premises location. |
| Premises Address | Address for the physical location which includes address lines 1 and 2. |
| Premises Latitude | Latitude for the physical location. |
| Premises Longitude | Longitude for the physical location. |
| Problem |
|
| Read Att | Number of read attempts. |
| Read Date | Date of the most recent valid reading for the specified day in MM/DD/YYYY format. |
| Read Fail | Type of read failure the reading device assigns. |
| Read Method | Indicates whether the endpoint is read by AMR or AMI. |
| Read Seq (Sequence) | Meter read order determined by the billing system. |
| Reading |
|
| Reason Not Geocoded | The reason the meter was not geocoded in the import file. Among the reasons is that the meter accuracy does not reach the required threshold. |
| Register ID | ID number for the register attached to the meter. |
| Route | List of all routes for the utility. |
| Route ID | The identifier for the route that the endpoint is contained in. The route ID is a combination of company code, office, cycle, and route. |
| Site ID / Name | Site identification number and site name. |
| SK Rate | The percentage of readings that were skipped for the route by the meter reader for the specified day (SK / Num Meters). Value is displayed in percentage format with one decimal. |
| SK Rate Route Avg | Route average rate of skipped readings. Number of unread meters for the meter reader for the specified day. |
| SK Rate vs Route Avg | Difference between the skipped rate and the route average since the inception of the route when readings began. Value is displayed in percentage format with one decimal. |
| Skip Code + Description | Code and description associated with the reason the meter was skipped for reading. |
| Skip Date / Time | Date and time the associated meter was skipped for reading within the route, in MM/DD/YYYY format. |
| Soft Disconnect End Date | End date of the Soft Disconnect period. |
| Soft Disconnect Start Date | Start date of the Soft Disconnect period. |
| Start Time | Time the readings began for the route (timestamp of the first AMR read captured) in HH:MM:SS (24 hour) format. AMI rows should be blank or display a dash ( - ) |
| State / Province | State or province of the meter location. |
| Status | Status of the meter / endpoint. See the Complete, Incomplete, and Skipped KPI for a definition of the status abbreviations. |
| Stop Time | Time the readings ended for the route (timestamp of the first AMR read captured) in HH:MM:SS (24 hour) format. AMI rows should be blank or display a dash ( - ) |
| Tamper Type |
The suspected type of tampering the meter experienced causing a disruption in flow. Tamper types are:
|
| Threshold | Status threshold of the meter. |
|
Timestamp / Last Reading Date and Time |
Date and time of the last meter reading in MM/DD/YYYY HH:MM:SS format. Depending on the report, this may be the last invalid reading. |
| Total Consumption | Total consumption for each endpoint included within the selected date range, formatted to 3 decimal places. |
| Total Elapsed Time (hh:mm) | Total time it took to capture all readings ([Stop time] – [Start time]) |
| Total MIUs |
|
| Total Route Average | Average reading for the total number of meter readings on the route. |
| Total vs Route Avg (hh:mm) | Difference between the total and the route average readings since the inception of the route when readings began. Route average is calculated based on AMR readings and AMI readings are excluded. |
| UOM |
Unit of measure for the water consumption:
|
| Utility | Name of the utility. |
| Value After | Value of the field that was changed to in the Mobile app. |
| Value Before | Value of the field from the import file. |
| Warning Symbol | Indicates an issue with the associated endpoint. Hover over the symbol to display suggestions to troubleshoot the endpoint. |
| Zip Code / Postal Code | Zip Code or Postal Code for the meter location. |
 ) at the beginning of the report row. The reading is available via mobile capture.
Meter Reader Drilldown
This report is a summary of the statistical data from the meter readings by the selected meter reader. You access this view by clicking the name of the meter reader in the Productivity report.
In addition to meter reader averages in the summary data, this view includes an active assignments pie chart that shows the total:
-
Total active reading assignments.
-
Meters read.
-
Meters unread.
-
Number of meters skipped.
The following table defines the summary data in this report.
| Data | Description |
|---|---|
| Meter Reader Averages | |
| Total Time | Average Total Elapsed Time across all routes. |
| Time Per Read | Average Elapsed Time across all routes. |
| Min Time Per Read | Average Min Elapsed Time across all routes. |
| Max Time Per Read | Average Max Elapsed Time across all routes. |
| Skip Rate | Average SK Rate across all routes. |
| Running Totals | |
| Time Meter Reading | Total time elapsed while reading meters across all routes. |
| Readings Captured | Total readings captured during the meter reading time. |
Reading History
The reading history shows the reading history by read date for the reader. The data in the reading history grid is an extraction of data in the Productivity report organized by cycle / route.
| Data | Description |
|---|---|
| Read Date | Date the route reading occurred. |
| Cycle Route | Cycle / Route identifier. The cycle / route is a link to the Walk Order Detail view. |
| Num RD | Number of meters captured by the meter reader for the specified day and route. |
| Num SK | Number of skipped readings by the meter reader for the specified day and route. |
| Total Elapsed Time (hh:mm) | Total time elapsed while reading meters on the cycle / route. |
| Avg Elapsed Time (mm:ss) | Average elapsed time per reading on the cycle / route. |
Walk Order Detail
The Walk Order Detail view shows a list of all AMR captured readings sorted chronologically by the reading timestamp (Date / Time column) in ascending order, with the oldest readings at the top of the view. You can access this view for a specific route / reading cycle from the Meter Reader Drilldown by clicking on the Cycle/Route hyperlink, or from the Route Drilldown by clicking on the Meter Reader hyperlink. The header below the title contains the Read Date, Route name, and the meter reader's name and email address.
The following table defines the column data in the grid.
| Data | Description |
|---|---|
| Read Seq (Sequence) | Meter read order determined by the billing system. |
| Account Name | Customer name on the account. |
| MIU ID | Endpoint ID to which the report data applies. |
| Address | Short version of the customer address associated with the account. |
| Elapsed Time (mm:ss) | Time elapsed between the reading and the one before it. |
| Date / Time | Date and timestamp corresponding with the reading, in MM/DD/YYYY HH:MM:SS format (24-hour time). |
| Comment Code | Comment codes associated with the endpoint. Codes are displayed as [Type] [Code]-[Description]. [Type] is abbreviated as CC. |
You can export this detail to an Excel file or to a PDF document.
The Walk Order Detail view has a search control above the grid that allows you to display reading anomalies.
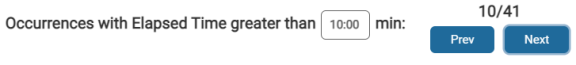
You can input the elapsed time threshold in mm:ss format, and use the  and
and  buttons to scroll through the grid to display rows with an elapsed time greater than the input threshold. The first number above the buttons indicates the total number of rows above the threshold, and the current row position in the grid.
You can sort the columns and click and drag column headers to move the columns to different locations in the grid.
