Dashboard KPI Details
The Neptune® 360™ KPI![]() Key Performance Indicator. A metric against which you measure performance of a system or asset. data provides key consumption metrics within your water utility network. These KPIs show water consumption within a specified time and you can drill down to see water usage data at the customer level. Dashboard data displays in your system’s default unit of measure.
Key Performance Indicator. A metric against which you measure performance of a system or asset. data provides key consumption metrics within your water utility network. These KPIs show water consumption within a specified time and you can drill down to see water usage data at the customer level. Dashboard data displays in your system’s default unit of measure.
System Consumption
The System Consumption KPI shows a snapshot of total water consumption over the last number of days/months/quarters you indicate for the KPI on the dashboard. You can show consumption for a maximum of 730 days (2 years). The default output is a bar graph and you can hover over each bar to display the total actual consumption for that period. This summary information is useful for analyzing usage trends and potential issues. The graph accounts for only claimed / imported endpoints.
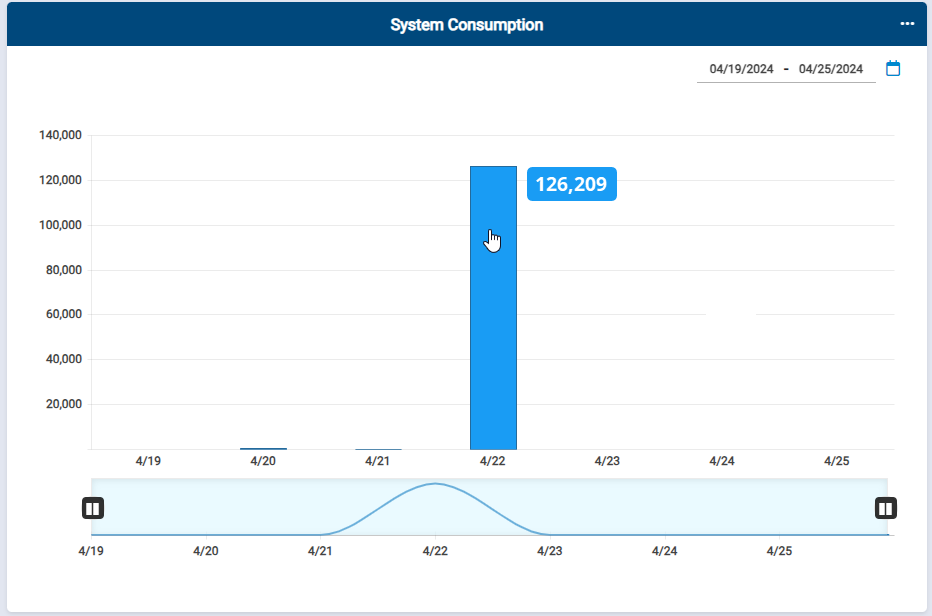
Clicking any bar in the graph or selecting View Detail Report displays the detail report for the KPI. The detail report shows the individual meters that contributed to a system’s total water consumption. The unit of measure used for the report is the same unit of measure that was applied in the Neptune 360 settings for the utility. If an account has a register with a different unit of measure compared to the utility’s unit of measure, the account is converted to the utility default unit of measure and includes ** in the Conv column of the report. You can export the details in the grid to a PDF or Excel file. The report can show information up to two years prior to the current date.
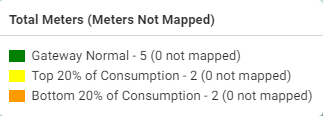
You can display the map for this KPI which shows a pin for each endpoint. Only endpoints with latitude and longitude coordinates are pinned on the map and the accounts are colored-coded based on their volume of consumption for the date range.
-
Green – normal consumption and total number of gateways with this level of consumption.
-
Yellow – top 20% of consumption and total number of endpoints in this category.
-
Orange – bottom 20% of consumption and total number of endpoints in this category.
The system calculates consumption percentile by dividing the percent range by the number of assets for the utility.

Top Meters by Consumption
The Top Meters by Consumption KPI shows a bar graph with the top accounts that consumed the most water over the selected lookback period. You define how many accounts to display when you edit the settings for the KPI. The total actual or estimated, based on the selected KPI setting consumption for an account displays as a bar to the right of the account name. This summary information is useful for analyzing usage trends and potential issues. This graph includes only claimed / imported endpoints.
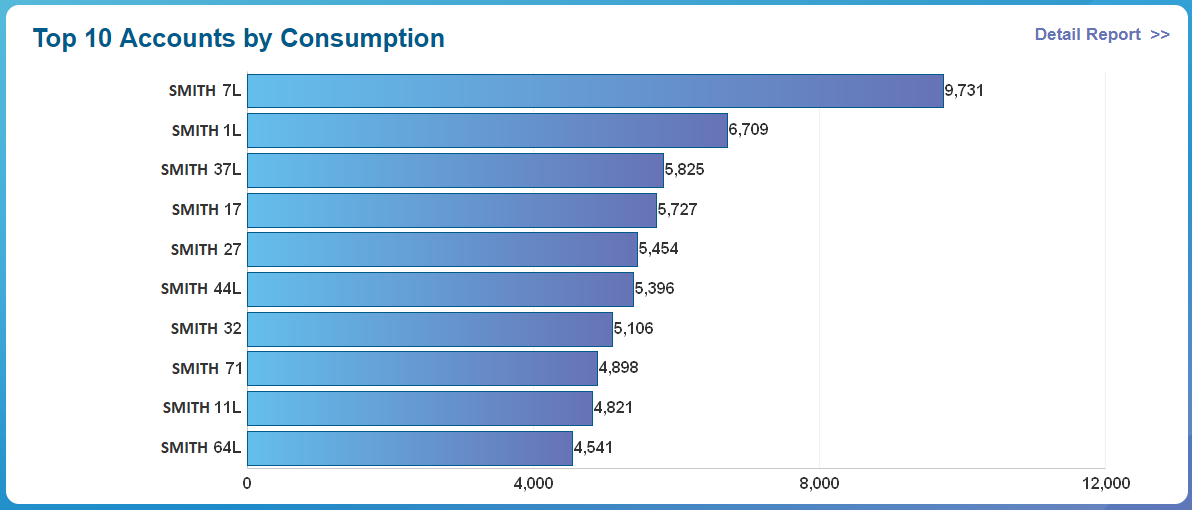
The unit of measure used for the report is the same unit of measure applied in the Neptune 360 settings for the utility. If an account has a register with a different unit of measure compared to the utility’s unit of measure, it is converted to the utility default unit of measure and the account includes ** in the Conv column of the report. You can export the details in the grid to a PDF or Excel file. The report can show information up to two years prior to the current date.
Only endpoints with latitude and longitude coordinates are pinned in the map. You can hover over any account to display further details.
Map
See View and Navigate the Grid Map for step instructions to display the map in the way you want.
Active Route Status
This section defines the details of the Active Route Status KPI that you can select to display in the dashboard. The meter reading statuses include:
-
Complete.
-
Incomplete:
- Unread.
- Invalid.
-
Skipped.
The KPI shows the count of endpoints of the status indicated within the configured number of Auto-Complete days set for a system. The overall count of this KPI includes only readings of endpoints in open routes. Open routes are routes that have been imported into Neptune 360 and have not been closed when exporting routes back to a CIS![]() Customer Information System. vendor. You can close a route by selecting the Close Route after Export option when exporting a route from the Export Files page in Neptune 360. The accounts of the endpoints can be in any status, such as active or inactive.
Customer Information System. vendor. You can close a route by selecting the Close Route after Export option when exporting a route from the Export Files page in Neptune 360. The accounts of the endpoints can be in any status, such as active or inactive.
The report includes a Read Method column that displays how the reading was captured, for example, using Neptune 360 Mobile or an AMI network. The Comments column displays any typed notes that a meter reader may have included with the reading when using Neptune 360 Mobile. The date and time of the readings are in local time.
System Received
This section defines the details of the System Received KPI that you can select to display in the dashboard. The read methods shown on the KPI include:
-
AMI.
-
AMR.
- AMR Auto.
- AMR Keyed.
-
Not Received.
The System Received KPI includes the count of claimed / imported endpoints with a reading captured using the indicated read method.
AMI shows the count of configurable claimed / imported endpoints with a reading captured from a radio endpoint in an AMI network. The KPI can be configured to show only active endpoints or to show all endpoints. AMR shows the count of endpoints with a reading capture through Neptune 360 Mobile via walk-by or drive-by method. If a reading is instead captured manually by keying in a reading using Neptune 360 Mobile, the Read Method columns displays AMR Keyed.
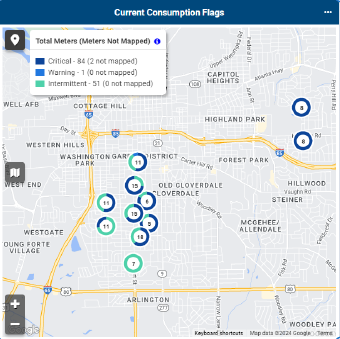
Current Consumption Flags - Critical, Warning, Minimal, Intermittent
The Current Consumption Flag KPI shows the count of claimed / imported endpoints reporting a continuous consumption flag that meet the set thresholds of the critical, warning, and minimal events in a system’s settings. The KPI also shows endpoints reporting an Intermittent Consumption flag. The Days column shows the consecutive number of days that an endpoint has experienced continuous consumption.
The accounts of the endpoints can be in any status, such as active or inactive. Endpoints are removed from this KPI when they no longer experience consumption, and are no longer transmitting a consumption flag.
Reverse Flow - Major and Minor
The Reverse Flow KPI shows the count of claimed / imported endpoints reporting a major or minor reverse flag. Major Reverse flow is defined as the reverse of the 6th digit on the face of the meter register by at least a whole digit, and Minor Reverse flow is the reverse of the 8th digit in the same manner. The accounts of the endpoints are configurable to show either only Active, or All endpoints (inactive and active). Endpoints are removed from this KPI when they no longer transmit a reverse flow flag.
Gateway Status - Critical, Warning, Minimal
The Gateway KPI shows the count of R900® gateways, R450™ data collectors, and R450™ mini collectors that meet the thresholds for the critical, warning, and minimal events in a system’s settings. For example, the critical threshold returns the count of R900® gateways, R450™ data collectors, and R450™ mini collectors that have not synced with Neptune 360 for a set number of hours.
Specific LoRaWAN® gateways also appear in this KPI if a system uses a TEKTELIC network. A system using a Senet network shows only one record for the entire network in this KPI and the record is labeled as LoRa. Systems with cellular endpoints also have CMIUA ![]() CMIU endpoint from AT&T as the provider.or CMIUV
CMIU endpoint from AT&T as the provider.or CMIUV ![]() CMIU endpoint from Verizon as the provider.records appear in this KPI for the entire network. CMIUA reflects an AT&T® network while CMIUV reflects a VERIZON™ network.
CMIU endpoint from Verizon as the provider.records appear in this KPI for the entire network. CMIUA reflects an AT&T® network while CMIUV reflects a VERIZON™ network.
The detail report includes a Gateway Name column which displays the name of a particular gateway or collector. The Last Sync Date/Time (Local Time) column shows the date and time, in local time, when a gateway, collector, or network last synced with Neptune 360.
The # Endpoints (MIUs) Received Last 24 Hours column displays the count of unique endpoints heard by a gateway, collector, or network. The number in this column is a link that displays the detail report showing the endpoint reading details received either through the gateway within the last 24 hours.
Temperature
The temperature KPI shows meters that have temperature reading capability (MACH® 10®) and the status of the temperature. Also note that this capability is only available in conjunction with the cellular endpoint type. The temperature readings are the most recent values in the UOM you define (Fahrenheit or Celsius), plus the date and time of the reading in MM/DD/YYYY hh:mm:ss format.
The detail temperature report also shows:
-
Minimum temperature threshold defined for each meter.
-
Maximum temperature threshold defined for each meter.
-
Temperature status - above the maximum threshold, below the minimum threshold, or within the normal range.
The temperature reading is based on historical data. You can select the UOM in which you want to show the temperature reading. Note that if you change the UOM, the system adjusts the temperature scale and reading.
Pressure
The pressure KPI shows meters that have pressure reading capability (MACH 10) and the status of the pressure. Also note that this capability is only available in conjunction with the cellular endpoint type. The pressure readings are the most recent values in the UOM you define (pounds per square inch or kilopascals), plus the date and time of the reading in MM/DD/YYYY hh:mm:ss format.
The detail pressure report also shows:
-
Minimum pressure threshold defined for each meter.
-
Maximum pressure threshold defined for each meter.
-
Pressure status - above the maximum threshold, below the minimum threshold, or within the normal range.
The pressure reading is based on historical data. You can select the UOM in which you want to show the pressure reading. Note that if you change the UOM, the system adjusts the pressure scale and reading.
